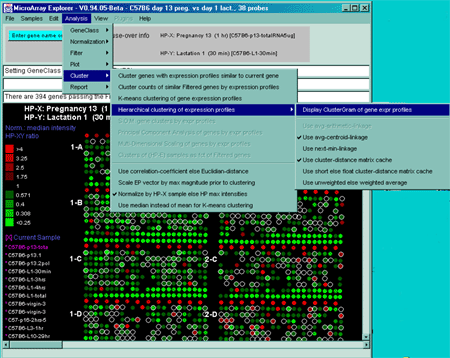
Figure 2.4.5 Cluster Menu options. The hierarchical clustering option is being selected.
Use of clustering to find patterns of similar gene expression
Clustering is a way of possibly finding co-expressed genes that exhibit similar expression changes in a set of samples. Genes may show similar co-expression, but that does not prove they are co-regulated at the same point in a pathway - merely that measurements of those genes in a particular set of experiments show similar expression. However, identifying genes with similar expression for which some information is already known about some of the genes may be useful as a starting point to help figure out gene function and possibly aspects of its pathways in cell function using additional experiments and analysis.There are many methods for doing clustering - each with advantages and disadvantages. We present three methods in MAExplorer and plan on adding a variety of more powerful methods through the MAEPlugin facility under development.
These methods may find genes belonging to particular clusters or genes that cluster well with particular genes. Gene clusters are sets of genes whose expression profiles are found to be similar according to a particular metric. We now define what we mean by "similar". The order list of hybridized samples used in computing the expression profiles are those in the HP-E list. MAExplorer has two different dissimilarity measures for Cij: Euclidean distance LSQdistij and Pearson correlation coefficient rij. These are computed as follows and are tested against the cluster distance threshold (set by the slider in the preferences sliders). Let n= |HP-E|, the number of samples in the expression profile. We define similarity as (1.0 - normalized dissimilarity).
| Hint: when working with very large data sets with many samples, it may be useful to pre-adjust the distance and/or number of clusters threshold sliders to an approximate range using the (Edit Menu | Preferences | Adjust all Filter threshold scrollers). This is because once the clustering starts, it does not (currently) let you abort the clustering to change the threshold value. |
   LSQdistij = Sqrt( Sum ( D'hj - D'hi) **2 ) / n
               h in HP-E
	       i,j in Filtered genes, i not j
Let,
   sumij = Sum( D'hj * D'hi ),
   mni = (1/n)Sum( D'hi ),
   mnj = (1/n)Sum( D'hj ),
   sumSqi = Sum( D'hi *  D'hi ),
   sumSqj = Sum( D'hj *  D'hj ),

then,
         [sumij - n*(mni * mnj)]
   rij = --------------------------------------------------------
         [Sqrt(sumSqi - n*n*mni*mni) * Sqrt(sumSqj - n*n*mnj*mnj)]
               h in HP-E
	       i,j in Filtered genes, i not j
The Cluster plots submenu contains a number of clustering
methods. Pressing the Escape key during a long cluster operation will
abort the operation. If you are in stand-alone mode using the
ClusterGram, a SaveAs GIF button will also be available for
saving the current plot as a full resolution GIF file specified by the
user in a popup file browser window.:
![]() Cluster genes with
expression profiles similar to current gene [RB] - click on
gene in image to find other genes with similar HP-E expression
profiles whose cluster distance is less than the cluster
distance threshold. The larger the blue
box, the higher the similarity.
Cluster genes with
expression profiles similar to current gene [RB] - click on
gene in image to find other genes with similar HP-E expression
profiles whose cluster distance is less than the cluster
distance threshold. The larger the blue
box, the higher the similarity.
![]() Cluster counts of
similar Filtered genes by expression profiles [RB] - draw
blue circles around filtered genes
indicating the number of other genes whose cluster similarity is
less than the cluster distance threshold. The larger the circle,
the more similar genes were found. Clicking on a gene switches
to the above mode.
Cluster counts of
similar Filtered genes by expression profiles [RB] - draw
blue circles around filtered genes
indicating the number of other genes whose cluster similarity is
less than the cluster distance threshold. The larger the circle,
the more similar genes were found. Clicking on a gene switches
to the above mode.
![]() K-means clustering of
gene expression profiles [RB] - draw
magenta circles around the N primary-node gene clusters
representing the gene closest to representing the center of the
cluster. Each of the nodes is a maximum distance from all other
nodes in the recursive definition of nodes. N is determined by
the State Scroller "# of Clusters". Changing N will recompute
the clusters. It then pops up a scrollable text window with the
clusters and indicates which genes belong to it. If you select
the EP plot button, it will draw the expression profiles
for the clustered genes. The Mn-Cluster-Report button
will generate report for all genes sorted by K-means
cluster. Summaries can be generated using the Mean EP
plot and Mn-Cluster-Report buttons. The SaveAs
GeneSets button saves all of the clusters as named Gene Sets
("Cluster #1", "Cluster #2", etc). If you change the filter or
current gene, you should explicitly use the Recompute
Clusters button to regenerate the new set of clustered
genes. When you recompute the K-means clusters, it uses the
current gene as the initial node.
K-means clustering of
gene expression profiles [RB] - draw
magenta circles around the N primary-node gene clusters
representing the gene closest to representing the center of the
cluster. Each of the nodes is a maximum distance from all other
nodes in the recursive definition of nodes. N is determined by
the State Scroller "# of Clusters". Changing N will recompute
the clusters. It then pops up a scrollable text window with the
clusters and indicates which genes belong to it. If you select
the EP plot button, it will draw the expression profiles
for the clustered genes. The Mn-Cluster-Report button
will generate report for all genes sorted by K-means
cluster. Summaries can be generated using the Mean EP
plot and Mn-Cluster-Report buttons. The SaveAs
GeneSets button saves all of the clusters as named Gene Sets
("Cluster #1", "Cluster #2", etc). If you change the filter or
current gene, you should explicitly use the Recompute
Clusters button to regenerate the new set of clustered
genes. When you recompute the K-means clusters, it uses the
current gene as the initial node.
![]() - this computes the hierarchical
clustering of the expression profiles (normalized by HP-X sample
data for each gene) of Filtered genes. The hierarchical
clusters are displayed in an ordered gene clustergram and
optional dendrogram. Sub-regions of the clustergram may be
explored in more detail using the EP-subset plot button,
or a report of the ordered genes can be created using the
ClustGram Report Note: you may add (remove) genes you
select from the Clustergram to the E.G.L. by holding the
Control(Shift) key while clicking on the gene name.
- this computes the hierarchical
clustering of the expression profiles (normalized by HP-X sample
data for each gene) of Filtered genes. The hierarchical
clusters are displayed in an ordered gene clustergram and
optional dendrogram. Sub-regions of the clustergram may be
explored in more detail using the EP-subset plot button,
or a report of the ordered genes can be created using the
ClustGram Report Note: you may add (remove) genes you
select from the Clustergram to the E.G.L. by holding the
Control(Shift) key while clicking on the gene name.
![]() S.O.M. gene clusters by
expr profiles [RB] - [Future MAEPlugin]
S.O.M. gene clusters by
expr profiles [RB] - [Future MAEPlugin]
![]() Multi-Dimensional
Scaling of genes by expr profiles [RB] - [Future MAEPlugin]
Multi-Dimensional
Scaling of genes by expr profiles [RB] - [Future MAEPlugin]
![]() Multi-Dimensional
Scaling of genes by exprprofiles [RB] - [Future MAEPlugin]
Multi-Dimensional
Scaling of genes by exprprofiles [RB] - [Future MAEPlugin]
![]() Clusters of (HP-E)
samples as fct of Filtered genes [RB] - [Future]
Clusters of (HP-E)
samples as fct of Filtered genes [RB] - [Future]
![]() Use correlation-coefficient
else Euclidian-distance [CB] - use the (1.0 - correlation
coefficient) as the distance metric instead of the default
Euclidean distance.
Use correlation-coefficient
else Euclidian-distance [CB] - use the (1.0 - correlation
coefficient) as the distance metric instead of the default
Euclidean distance.
![]() Scale EP vector by max
magnitude prior to clustering [CB] - scale each sample in
the EP by the max magnitude for all sample values in the EP.
Scale EP vector by max
magnitude prior to clustering [CB] - scale each sample in
the EP by the max magnitude for all sample values in the EP.
![]() Normalize by HP-X sample else
HP max intensities [CB] - normalize data by the
corresponding HP-X sample data for each gene or the maximum raw
intensity for each HP in the expression profile.
Normalize by HP-X sample else
HP max intensities [CB] - normalize data by the
corresponding HP-X sample data for each gene or the maximum raw
intensity for each HP in the expression profile.
![]() Use median instead of mean
for K-means clustering [CB] - use the clustering (see (Bickel, 2001)).
Use median instead of mean
for K-means clustering [CB] - use the clustering (see (Bickel, 2001)).
The Hierarchical Cluster plots submenu contains:
![]() Display ClusterGram of gene
expr profiles [CB] - compute the hierarchical clustering of
the expression profiles (normalized by HP-X sample data for each
gene) of Filtered genes. Then display the hierarchical clusters
in an ordered gene clustergram and optional dendrogram when the
dendrogram checkbox is selected. Expression profile
plots of the clustergram may be explored in more detail using
the EP plot button that generates a scrollable list of
all EP plots ordered by the same order as the clustergram. A
full report of the ordered genes expression profiles may be
created using the ClustGram Report button.
Display ClusterGram of gene
expr profiles [CB] - compute the hierarchical clustering of
the expression profiles (normalized by HP-X sample data for each
gene) of Filtered genes. Then display the hierarchical clusters
in an ordered gene clustergram and optional dendrogram when the
dendrogram checkbox is selected. Expression profile
plots of the clustergram may be explored in more detail using
the EP plot button that generates a scrollable list of
all EP plots ordered by the same order as the clustergram. A
full report of the ordered genes expression profiles may be
created using the ClustGram Report button.
![]() Use avg-arithmetic-linkage [RB] - set the hierarchical
clustering linkage method to the average arithmetic linkage of
sub-clusters.[ Future]
Use avg-arithmetic-linkage [RB] - set the hierarchical
clustering linkage method to the average arithmetic linkage of
sub-clusters.[ Future]
![]() Use avg-centroid-linkage
[RB] - set the hierarchical clustering linkage method to
average centroid linkage of sub-clusters (default).
Use avg-centroid-linkage
[RB] - set the hierarchical clustering linkage method to
average centroid linkage of sub-clusters (default).
![]() Use next-min-linkage
[RB] - set the hierarchical clustering linkage method to the
next minimum distance sub-cluster linkage in random order.
Use next-min-linkage
[RB] - set the hierarchical clustering linkage method to the
next minimum distance sub-cluster linkage in random order.
![]() Use cluster-distance matrix
cache [CB] - if you do not have enough memory for clustering
large gene sets, disable the cache. It will take MUCH longer
without the cache. When clustering, if there is
not enough memory available for the cache, it will warn you and
suggest you either reduce the number of genes being clustered or
use a computer with more memory.)
Use cluster-distance matrix
cache [CB] - if you do not have enough memory for clustering
large gene sets, disable the cache. It will take MUCH longer
without the cache. When clustering, if there is
not enough memory available for the cache, it will warn you and
suggest you either reduce the number of genes being clustered or
use a computer with more memory.)
![]() Use short else float
cluster-distance matrix cache [CB] - if there is not enough
memory for the set of genes you wish to cluster and you still
want to use the cache, you can use 16-bit (i.e. short) data
instead of the 32-bit (i.e. float) data. The results will be
less precise.
Use short else float
cluster-distance matrix cache [CB] - if there is not enough
memory for the set of genes you wish to cluster and you still
want to use the cache, you can use 16-bit (i.e. short) data
instead of the 32-bit (i.e. float) data. The results will be
less precise.
![]() Use un-weighted else
weighted average [CB] - set the hierarchical clustering vector
averaging to un-weighted (the default weights it by the number
of genes in that sub-cluster). Otherwise using weighted gives
equal (0.50) weighting to each sub-cluster.
Use un-weighted else
weighted average [CB] - set the hierarchical clustering vector
averaging to un-weighted (the default weights it by the number
of genes in that sub-cluster). Otherwise using weighted gives
equal (0.50) weighting to each sub-cluster.
Handling of hierarchical clustering of large numbers of genes - problem with slow response
The hierarchical clustering algorithm uses a gene-gene floating point (i.e. 32-bit) distance matrix of order N2 (for N data filtered genes). This means that if you are experiencing a slow response, this may be due to several factors some of which you may not be able to control. You might:- If you determine that your computer is "paging", use a computer with more memory. The currently distributed stand-alone version will use up to 256 Mbytes of chip memory.
- If that is not possible, reduce the number of genes being clustered. Even if you have enough memory, the computation is still high if N is large.
- Set the Use short else float cluster-distance matrix cache option in the cluster plot menu. This reduces the memory requirements for the distance matrix by 1/2.
2.4.5.1 Cluster genes with expression profiles similar to current gene
The Cluster genes with expression profiles similar to current
gene is used to find genes with similar HP-E expression profiles
as measured by the least square error that are less than the cluster
distance threshold. It pops up the "Cluster Distance" threshold
scroller. Then click on a gene in the microarray image. It then pops
up up a window with a list of the similar genes and their expression
profile distances to the current gene. Each gene that passes the
cluster distance threshold test is indicated in the image with a blue square where the size of the square is
proportional to its similarity. It also displays a sorted list of the
genes with the cluster distance in the cluster panel that was popped
up. On each lines is a series of '*****' - the more stars the higher
the similarity to the seed gene. This is a silhouette plot that
is used to display a sorted list of similar objects and is described
to that described in (Kaufman and
Rousseeuw, 1990).
Larger squares indicate that more genes are similar. You may
change the cluster distance threshold and it will update the display
and the list. In addition, the 'edited gene list' is set to the
subset of genes that belong to the current cluster.
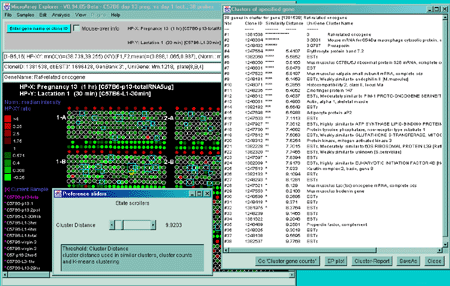
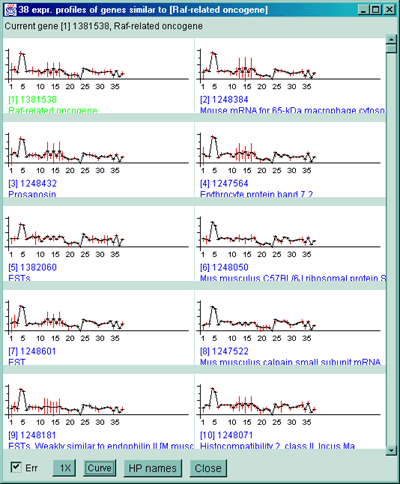
Figure 2.4.5.1 Similar genes clustered to the current gene. This method finds all genes that are similar to the current gene as those defined by their distance between expression profiles being less than the threshold set by the user. Each gene that passes the cluster distance threshold test is indicated in the image with a blue square where the size of the square is proportional to its similarity. This data is from the 38 samples in the MGAP database containing duplicated spots. A) Main windows with popup cluster similarity report and cluster distance threshold slider. B) Scrollable list of EPplots of similar genes with the red error bars indicating the variation for duplicated spots for each HP sample. The Err checkbox may turn the error bar overlays on and off.
For both of these commands, if you want to view the expression profile
plots, click on the EP plot button in the cluster window and it
pops up the scrollable expression profiles window. If you click on a
gene in the image, it will select it as the new current gene and seed
gene and recompute the cluster of genes most similar to the new see
gene.
For both of these commands, if you want a permanent report, click on
the "Cluster Report" button in the cluster window and it will generate
a report in the current modality (i.e. scrollable spreadsheet or
tab-delimited). You may switch between these two modes by pressing
the "Go '...'" button in the report.
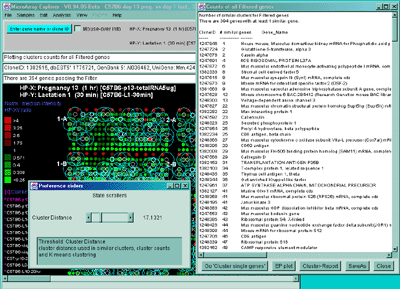
Figure 2.4.5.2 Display of cluster counts for all genes less than
the cluster threshold from MGAP 38 sample database. The algorithm
counts the number of similar genes for each Filtered gene and draws
a blue circle whose size is proportional to
the number of genes similar to that gene. That is why there are a larger
number of the larger circles.
Figure 2.4.5.3 Genes clustered using the K-means cluster
method. A) Using the current gene as the initial cluster,
MAExplorer finds N orthogonal clusters assigning the set of filtered
genes to these clusters using the HP-E expression profiles. All
genes are iteratively assigned to these clusters. Genes belonging to
the current cluster are labeled with a green cluster number both in
the array and in the scatter plot. The slider determines the number of
clusters (set to 6 here). A 2D scatter plot shows the genes belonging
to cluster 6. The K-means cluster report on the right contains a sorted
list of the genes in each cluster and has buttons to generate EP
plots and reports as well as summary mean EP plots (shown) and mean
cluster reports. The detailed list is shown below. B) Part of
the scrollable EP plots for this data showing genes belonging to both
clusters #5 and #6. C) The mean EP plots for the 6 clusters.
We call the genes closest to the "center" of the K clusters primary
genes and they are reported with additional information. The "Cluster
[# genes]" entries in the distance-to-cluster fields indicates that
these genes are the center of the clusters (i.e. primary genes). The
distNext is the distance from this cluster center to the next nearest
K-means cluster center. The number of clusters N (6 in this example)
is set in the popup state scroller. If you change the value of N, it
will recompute the clusters and the primary genes.
It draws magenta circles around the
primary genes in the microarray and the cluster number to the right of
the circle. The size of a circle corresponds to the number of genes
clustered with that circle. If you click on a gene belonging to any
cluster, it defines that cluster as the "current cluster". It will
change the labels of the subset of genes that belong to the current
gene from red (white) circle to a green (yellow) cluster number of the
current cluster in the intensity (ratio) pseudoarray image. In addition,
the 'edited gene list' is set to the subset of genes that belong to
the current cluster. If you are also displaying a scatter plot, genes
in the current cluster have their red '+' characters changed to the
cluster number.
You can click on that gene in the array image to determine its
identity. You may also popup an ordered (same as the above report)
plot of the clusters expression profiles by clicking on the EP
plot button. You may plot the mean expression profiles of the N
clusters using the Mean EP plot button. You may generate a
report of all of the clustered genes or of the mean clusters using the
Cluster-Report or Mn-Cluster-Report buttons
respectively. If you change the Filter conditions, you may recompute
the clusters using the Recompute Clusters button. Closing the
text window will remove the magenta
circles. If you selected the current cluster, the genes that
belong to it will still be available in the 'edited gene list' for
making reports, saving as a gene subset or for additional gene
filtering. If you press the SaveAs GeneSets button, then K gene
sets are created with the names "Cluster#1", "Cluster#2", ...,
"Cluster#K". You can then save or rename the clusters you want and
delete the rest. If you press the ClusterGram button, it
displays the gene sets in a cluster gram order the same way as
the cluster report.
Clustering is represented by a binary tree and is visualized as an
ordered gene clustergram and optional dendrogram sub-plot. This is
similar to the methods of (DeRisi,
1996), (Eisen, 1998), and
(White, 1999). Currently,
MAExplorer does 1-way clustering - not the 2-way clustering of (Weinstein, 1998) and (Eisen, 1998). Each row of the
clustergram represents a gene and each column represents a HP in the
HP-E list of samples. Each box in a row represents the normalized
expression of that gene for the HP represented in that column. The
color of the box is one of 9 colors representing the normalized
expression ranges and assigned according to the following table:
Table 2.4.5.4. ClusterGram pseudocolor assignments. The
colors are assigned to "box" entries in the clustergram corresponding
to genes. The color represents data as either the X/Y ratio or X-Y
Zdiff relative to the normalizing HP.
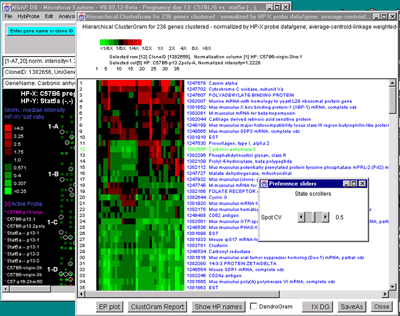
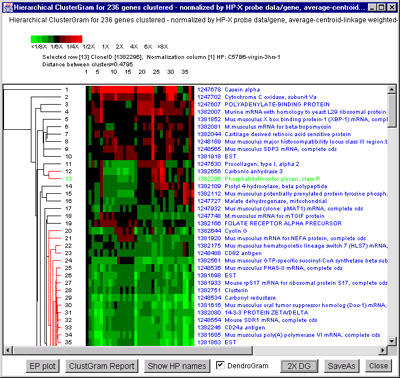
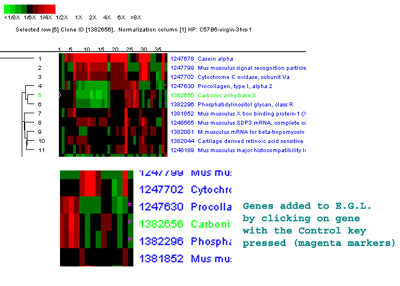
Figure 2.4.5.4 Hierarchical clustering clustergram of genes
filtered by ratio histogram bins for 19 samples from the MGAP data
set. The hybridized samples are drawn as colored boxes in the 19
columns. Rows of boxes correspond to gene expression profiles. In
A), the set of all genes and ESTs was filtered by the CV filter
set to 0.387 and the normalization was the Zscore. The gene "Mus
musculus D9 spice variant 2 mRNA, complete cds" was selected as the
current gene in the clustergram. Data for this gene and the selected
HP column is indicated at the top of the clustergram. The list of the
19 samples is shown on the left. B) Details of clustergram and
dendrogram are shown where the user had selected a cluster distance
threshold at "Mouse mRNA for mitochondrial cytochrome c oxidase
subunit Vb" in the dendrogram part of the plot (zoomed by 2X). This
selection draws all parts of the dendrogram tree that are less than
this distance are drawn in red. C) shows the manual selection
of genes from the ClusterGram or Dendrogram by clicking on the genes
names you wish to capture in the Edited Gene List (EGL) while the
Control key is pressed. The zoomed subregion shows three genes in the
same cluster that were selected (magenta stars in the right edge of
the ClusterGram).
2.4.5.2 Cluster counts of similar filtered genes by expression profiles
The Cluster counts of similar Filtered genes by expression
profiles command analyzes the set of all Filtered genes for the
expression profile defined by the HP-E samples. It counts the number
of similar genes for each Filtered gene and draws a
blue circle whose size is proportional to the number of genes
similar to that gene. After it analyses these genes it lists the
genes and their counts in the cluster panel. You may change the
cluster distance threshold and/or Filter parameters and it will update
the display and the list. If you click on a gene with a green circle, it will switch to single gene
cluster mode (with the blue squares).
2.4.5.3 K-means clustering' gene expression profiles for filtered genes
The K-means cluster gene expression profiles for Filtered genes
command searches the data Filtered gene list for the genes
(i.e. primary genes) with the N most orthogonal expression
profiles. It will start this recursive computation from the gene with
minimum distance to all other genes unless you have selected a
"current gene" with the mouse. All Filtered genes are assigned to the
nearest K-means primary node. The mean cluster vector is computed and
used as the new definition of the cluster center. If you set the "Use
median instead of mean for K-means clustering" option in the
Clustering submenu, it will compute the center as a median instead of
a mean (Bickel, 2001). K-means
clustering is described in (Sneath
and Sokol, 1973). A new K-means primary gene (i.e. gene for the
cluster center) is found that is closest to this new center. Then all
of the data Filtered genes are reassigned to the new cluster
centers. The mean+-stdDev of the within-cluster distance to its center
is computed. It then pops up a text window with an ordered report of
the Filtered genes illustrated by part of a report shown below. [This
is part of a report from a 38 sample MGAP database subset of 141 genes
from the set of named genes restricted by the CV data filter.] Note
that clusters where the "Similarity" data is plotted as a silhouette plot use
variable length strings of '****' is about the same for the entire
cluster (e.g. cluster #4) contain genes that probably belong together
in the same cluster. Clusters that do not (e.g. Cluster 6) probably
contain two smaller more robust clusters.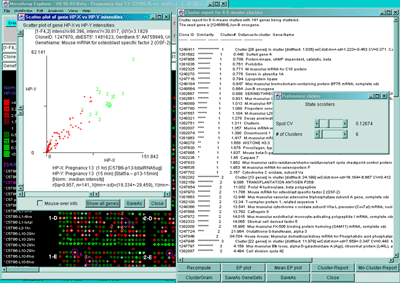
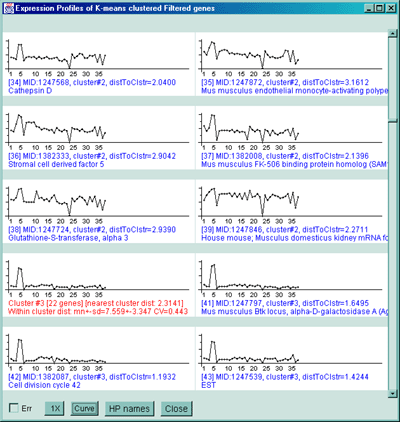
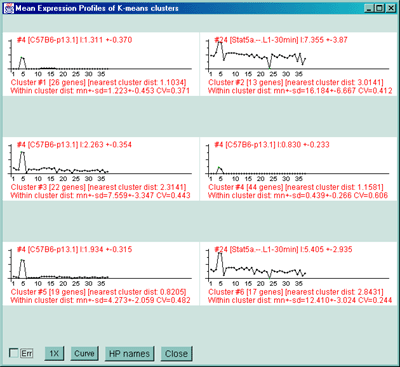
Cluster report for 6 K-means clusters with 141 genes being clustered.
The seed gene is [1248564] Jun-B oncogene.

Clone ID  Similarity      Cluster-#  Distance-to-cluster  Gene-Name
--------  --------------  ---------  -------------------  ----------------

1248411   **************  1          Cluster [26 genes] in cluster [distNext: 1.035] wiCdist:mn+-sd=1.223+-0.453 CV=0.371  Calpactin I light chain
1381592   **********      1          0.448  Surfeit gene 4
1247956   *********       1          0.706  Protein kinase, cAMP dependent, catalytic, beta
1381836   ********        1          0.761  Prohibitin
1382325   ********        1          0.771  M.musculus mRNA for C1D protein
1248270   ********        1          0.775  Seven in absentia 1A
1247716   ********        1          0.794  Lipoprotein lipase
1248184   ********        1          0.847  Mus musculus bromodomain-containing protein BP75 mRNA, complete cds
1248564   *******         1          0.864  Jun-B oncogene
1382667   *******         1          0.888  SERINE/THREONINE PROTEIN PHOSPHATASE PP2A-BETA, CATALYTIC SUBUNIT
1382561   *******         1          0.931  Mus musculus GTP-specific succinyl-CoA synthetase beta subunit (Scs) mRNA, partial cds
1248089   ******          1          1.013  M.musculus RPS3a gene
1247780   ******          1          1.088  Proprotein convertase subtilisin/kexin type 7
1247557   ******          1          1.104  M.musculus L28 mRNA for ribosomal protein L28
1248321   *****           1          1.278  Decay accelerating factor 1
1382751   ****            1          1.311  Clusterin
1382007   ****            1          1.357  Murine mRNA with homology to yeast L29 ribosomal protein gene
1382074   ****            1          1.390  Orosomucoid 1
1381963   ****            1          1.417  M.musculus mRNA for ribosomal protein L36
1248278   **              1          1.658  HISTONE H3.3
1247630   **              1          1.675  Procollagen, type I, alpha 2
1247865   *               1          1.837  Mouse beta-D-galactosidase fusion protein mRNA, complete cds
1382236   *               1          1.85  Caspase 7
1247833                   1          1.882  Mus musculus radio-resistance/chemo-resistance/cell cycle checkpoint control protein (Rad9) mRNA, complete cds
1248535                   1          1.953  M.musculus mRNA for selenoprotein P
1247702                   1          2.157  Cytochrome C oxidase, subunit Va
1382282   **************  2          Cluster [13 genes] in cluster [distNext: 24.199] wiCdist:mn+-sd=16.184+-6.667 CV=0.412  Max interacting protein 1
1382159   **********      2          9.086  TRANSPLANTATION ANTIGEN P35B
1247854   *********       2          11.002  Prolyl 4-hydroxylase, beta polypeptide
1247970   ********        2          11.786  Mouse mRNA for osteoblast specific factor 2 (OSF-2)
1381663   ********        2          12.948  Mus musculus vacuolar adenosine triphosphatase subunit A gene, complete cds
1382100   ********        2          13.34  T-complex protein 1, related sequence 1
1248366   ********        2          13.541  Mus musculus cytochrome c oxidase subunit VIIa-L precursor (Cox7al) mRNA, nuclear gene encoding mitochondrial protein, complete cds
1247568   ********        2          13.762  Cathepsin D
1247872   *******         2          14.015  Mus musculus endothelial monocyte-activating polypeptide I mRNA, complete cds
1382333   *******         2          14.065  Stromal cell derived factor 5
1382008   *******         2          15.985  Mus musculus FK-506 binding protein homolog (SAM11) mRNA, complete cds
1247724   ****            2          21.964  Glutathione-S-transferase, alpha 3
1247846                   2          34.704  House mouse; Musculus domesticus kidney mRNA for Phosphatidic acid phosphatase, complete cds
1247945   **************  3          Cluster [22 genes] in cluster [distNext: 11.979] wiCdist:mn+-sd=7.559+-3.347 CV=0.443  Mus musculus mRNA for DEDD protein
1247797   **********      3          4.159  Mus musculus Btk locus, alpha-D-galactosidase A (Ags), ribosomal protein (L44L), and Bruton's tyrosine kinase (Btk) genes, complete cds
1382087   **********      3          4.494  Cell division cycle 42
1247539   **********      3          4.511  EST
1248212   **********      3          5.009  Murine mRNA for integrin beta subunit
1248470   **********      3          5.044  EST
1247521   *********       3          5.299  Mus musculus mRNA for peroxisomal integral membrane protein PMP34
1381808   *********       3          5.924  Mus musculus UDP-GalNAc:polypeptide N-acetylgalactosaminyltransferase-T3 mRNA, complete cds
1381970   *********       3          6.285  Mus musculus thioredoxin mRNA, nuclear gene encoding mitochondrial protein, complete cds
1382168   *********       3          6.343  N-terminal Asn amidase
1382704   *********       3          6.36  Mus musculus N-myristoyltransferase 1 mRNA, complete cds
1248548   *********       3          6.378  Mus musculus WDR protein mRNA, complete cds
1247564   ********        3          6.652  Erythrocyte protein band 7.2
1248588   ********        3          6.67  M.musculus BAP31 mRNA
1247541   ********        3          6.690  Apolipoprotein D
1248462   ********        3          7.322  Sterol O-acyltransferase 1
1248462   ********        3          7.42  Sterol O-acyltransferase 1
1248521   ******          3          9.121  Mus domesticus nuclear binding factor NF2d9 mRNA, complete cds
1382212   ******          3          10.137  Thyroid autoantigen 70 kDa
1382270   *****           3          10.529  Voltage-dependent anion channel 2
1248152   *****           3          10.541  M. musculus mRNA for MAP kinase-activated protein kinase 2
1247678                   3          19.431  Casein alpha
1247543   **************  4          Cluster [44 genes] in cluster [distNext: 1.035] wiCdist:mn+-sd=0.439+-0.266 CV=0.606  RAS-related C3 botulinum substrate 1
1381923   ************    4          0.158  Prolyl 4-hydroxylase, beta polypeptide
1382052   ************    4          0.209  Trans-acting transcription factor 1
1247882   ***********     4          0.237  Mus musculus AMP activated protein kinase mRNA, complete cds
1248099   ***********     4          0.246  Mus musculus mitogen-responsive 96 kDa phosphoprotein p96 mRNA, alternatively spliced p67 mRNA, and alternatively spliced p93 mRNA, complete cds
1248351   ***********     4          0.251  Abl-interactor 1
1247540   ***********     4          0.255  Mus musculus mRNA for ZIP-kinase, complete cds
1248316   ***********     4          0.26  Mus musculus proteasome alpha7/C8 subunit mRNA, complete cds
1382671   ***********     4          0.264  Mouse MA-3 (apoptosis-related gene) mRNA, complete cds
1382014   ***********     4          0.277  Transcription elongation factor B (SIII), polypeptide 1 (15 kDa),-like
1247885   ***********     4          0.289  Mus musculus mRNA for ryudocan core protein, complete cds
1248294   ***********     4          0.292  Mus musculus thioredoxin-related protein mRNA, complete cds
1382066   ***********     4          0.306  Inhibitor of DNA binding 2
1248597   ***********     4          0.307  Lipocortin 1
1248591   ***********     4          0.324  Interferon beta, fibroblast
1248445   **********      4          0.333  Mus musculus beta prime coatomer protein mRNA, partial cds
1247775   **********      4          0.34  House mouse; Musculus domesticus male brain mRNA for ARF1, complete cds
1382750   **********      4          0.340  Thymoma viral proto-oncogene
1247905   **********      4          0.341  Monokine induced by gamma interferon
1381668   **********      4          0.351  Mus musculus mitogen-activated protein kinase-activated protein kinase mRNA, complete cds
1381811   **********      4          0.356  Protein tyrosine phosphatase, receptor type, D
1382031   **********      4          0.358  Protease (prosome, macropain) 28 subunit, beta
1248345   **********      4          0.363  Mus musculus alpha-methylacyl-CoA racemase mRNA, complete cds
1382555   **********      4          0.364  Lysosomal membrane glycoprotein 1
1247820   **********      4          0.367  Tight junction protein 1
1247598   **********      4          0.374  Retinoblastoma 1
1247595   **********      4          0.378  PROBABLE CALCIUM-BINDING PROTEIN PMP41
1381928   **********      4          0.379  Mus musculus MRJ (Mrj) mRNA, complete cds
1248196   **********      4          0.399  Max protein
1381691   **********      4          0.423  SRY-box containing gene 17
1248225   **********      4          0.434  Mus musculus heat shock transcription factor 1 (Hsf1) gene, partial cds
1248084   **********      4          0.442  Mus musculus Supl15h gene
1247941   *********       4          0.453  Fibroblast growth factor inducible 14
1381623   *********       4          0.468  Stearoyl-coenzyme A desaturase 1
1248202   *********       4          0.473  Mouse mRNA for PAP-1, complete cds
1382115   *********       4          0.512  GLUTATHIONE S-TRANSFERASE GT8.7
1382044   *********       4          0.515  Cartilage derived retinoic acid sensitive protein
1381636   ********        4          0.567  Lymphotoxin B
1381920   ********        4          0.569  Mus musculus mRNA for NEFA protein, complete cds
1247757   ********        4          0.596  Granzyme B
1382094   ********        4          0.609  High mobility group protein 1
1247545   ********        4          0.638  Carbon catabolite repression 4 homolog (S. cerevisiae)
1247607   ***             4          1.188  POLYADENYLATE-BINDING PROTEIN
1247727                   4          1.667  Malate dehydrogenase, mitochondrial
1248244   **************  5          Cluster [19 genes] in cluster [distNext: 3.473] wiCdist:mn+-sd=4.273+-2.059 CV=0.482  CD80 antigen
1248534   **********      5          1.648  Carbonyl reductase
1247764   **********      5          1.776  H-2 CLASS II HISTOCOMPATIBILITY ANTIGEN, GAMMA CHAIN
1381933   *********       5          2.345  Mouse rpS17 mRNA for ribosomal protein S17, complete cds
1381616   *********       5          2.42  Mus musculus oral tumor suppressor homolog (Doc-1) mRNA, partial cds
1248232   *********       5          2.486  Mus musculus putative glycogen storage disease type 1b protein mRNA, complete cds
1382644   ********        5          2.717  Cyclin G
1248125   ********        5          2.791  Histocompatibility 2, class II, locus Mb2
1247799   ********        5          2.869  Mus musculus signal recognition particle receptor beta subunit mRNA, complete cds
1247708   ********        5          3.024  Ephrin A1
1247932   ******          5          4.235  Mus musculus (clone: pMAT1) mRNA, complete cds
1382515   *****           5          4.668  ATPase, Na+/K+ beta 3 polypeptide
1248586   *****           5          4.838  Mus musculus viral envelope like protein (G7e) gene, complete cds
1248198   ***             5          5.874  Mus musculus D9 splice variant 2 mRNA, complete cds
1381623   **              5          6.224  Stearoyl-coenzyme A desaturase 1
1382086   *               5          6.885  Mus musculus (strain C57Bl/6) mRNA sequence
1247887   *               5          7.014  Mouse chromosome 6 BAC-284H12 (Research Genetics mouse BAC library) complete sequence
1247886                   5          7.810  Cut (Drosophila)-like 1
1248303                   5          8.094  Lipopolysaccharide response
1247621   **************  6          Cluster [17 genes] in cluster [distNext: 19.157] wiCdist:mn+-sd=12.410+-3.024 CV=0.244  Mus musculus Lsc (lsc) oncogene mRNA, complete cds
1248050   *******         6          7.407  Mus musculus C57BL/6J ribosomal protein S28 mRNA, complete cds
1247698   *******         6          7.571  Adipocyte protein aP2
1248240   *****           6          9.198  Mus musculus mRNA, complete cds
1247862   ****            6          9.844  Mus musculus Nmi mRNA, complete cds
1382162   ****            6          10.330  CAMP responsive element modulator
1248398   ***             6          11.007  Mouse mRNA for ribosomal protein S12
1248281   ***             6          11.143  M.musculus mRNA for histone H3.3A
1247852   ***             6          11.576  Twist gene homolog, (Drosophila)
1381991   **              6          12.809  Prolyl 4-hydroxylase, beta polypeptide
1382753   **              6          13.019  Mus musculus cleavage and polyadenylation specificity factor (MCPSF) mRNA, complete cds
1248368   *               6          13.639  Mus musculus ribosomal protein S26 (RPS26) mRNA, complete cds
1247639   *               6          13.692  SRY-box containing gene 4
1248435                   6          14.262  Thymus cell antigen 1, theta
1247961                   6          14.75  ATP SYNTHASE ALPHA CHAIN, MITOCHONDRIAL PRECURSOR
1248344                   6          15.217  Gut enriched Kruppel-like factor
1382234                   6          16.351  CD8 antigen, beta chain
2.4.5.4 Hierarchical clustering of expression profiles
The Hierarchical clustering of expression profiles computes the
hierarchical clustering of the expression profiles of data Filtered
genes and displays a clustergram and optional dendrogram.
Hierarchical clustering is described in ( Sneath and Sokol, 1973). The gene
data is normalized either by the corresponding HP-X sample data for
each gene or the maximum raw intensities for each HP sample in the
expression profile set by the Normalize by HP-X else HP's max
intensities menu toggle. There are three types of clustering
linkages: average-arithmetic-linkage,
average-centroid-linkage, and next minimum
linkage. These may be modified using the weighted average
that gives equi-weighting to the child clusters in computing the mean
of a new cluster, and un-weighted-average that weights them by
the number of non-terminal clusters. The average-linkage clustering is
very compute intensive and takes a while. The next-minimum-linkage is
much faster and may result in adequate clustering for some
situations.
.
.
.
.
.
.
.
.
.
bright green
.
.
dark green
Black
dark red
.
.
bright red
<1/8X
1/6X
1/4X
1/2X
1X
2X
4X
6X
>8X
The current gene may be set by clicking on a row that is then
highlighted in green. If you click on a colored box, it will also
report the HP name for that column and its normalized expression value
(highlighting that box with a white circle). If the Web genomic
databases are enabled (through the View menu, then it will also popup
a Web page for that gene). If you set the current gene in any of the
array, scatter plot, gene guesser, etc. displays, it will set it for
and position the clustergram at that gene. If the Dendrogram
checkbox is enabled, then a dendrogram is drawn to the left of the
clustergram boxes. Clicking on a region in the dendrogram sets a
distance threshold (displayed at the top) and displays all parts of
the dendrogram tree in red that have a cluster distance less than what
you defined. If the zoom nnX button is pressed, then the
of dendrogram drawing is magnified by nnnn-fold to make highly similar
clusters more visible. Pressing the button repeatedly cycles through:
1X, 2X, 5X, 10X, 20X. Sub-regions of the clustergram may be explored
in more detail using the EP plot button that pops up a
scrollable window of the ordered gene list. You may generate
multiple EP-subset plots so as to compare different parts of the
clustergram. A report of all of the ordered genes may be created
using the ClustGram Report button. The Show HP names
button pops up a numbered list of all samples used in the expression
profiles and clustergram. This report has all of the normalized
expression profiles on the right side of the report.
