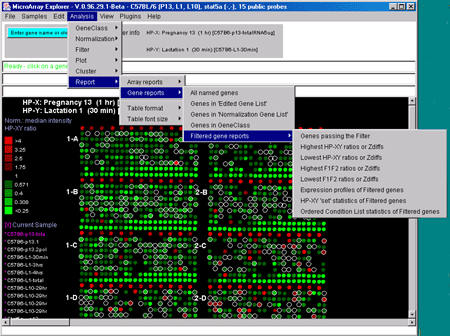

Figure 2.4.6 Reports menu. You may create either dynamic or tab-delimited text reports of either Samples or of subsets of genes.
These may be presented as interactive dynamic tables as well as scrollable text windows capable of being exported to Excel. If Web DB access is enabled, clicking on an entry will bring up a Web browser with access to GenBank data. If the report contains Clone ID as one of the fields, you can click on it to have it define that gene as the current gene and highlight it in the microarray image or scatter plot (if it is being used). The reports are divided into two types - those dealing with lists of arrays (i.e. the sample experimental condition) and those dealing with lists of genes.
The Report menu includes:
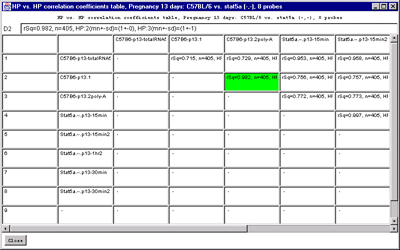
The "Samples vs Samples correlation coefficients" computes the correlation
coefficients in an upper diagonal matrix for the current set of
Filtered genes showing HP samples similarity. Then entries are of the
following form where HP:1 and HP:2 correspond to samples listed in the
field names of the table and the data is the intensity values using
the current normalization method.
The "Calibration DNA summary" table contains the computed means,
std-dev, and computed normalization scale factor for all active
hybridized samples. The scale factors are used if the 'Calibration
DNA' normalization is used.
You must set the Web access checkbox if you want to click on a blue
hyperlink in the resulting report to access an associated Web
database.
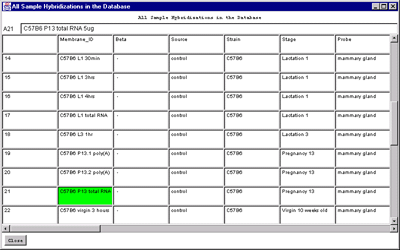
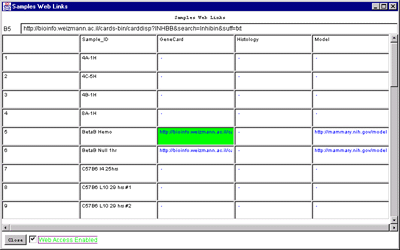
Figure 2.4.6.1 Hybridized samples dynamic Report windows. A)
Samples Info report. B) Sample Web links. Clicking on a blue
hypertext link brings up the corresponding genomic Web database entry
in a separate Web browser window if the Web access is enabled. The
tab-delimited version of the same reports (not shown) may be cut and
then pasted into other programs such as an Excel spreadsheet.
C) HP vs HP correlation table on genes passing the data
Filter for all samples in the HP-=E list.
If Cy3/Cy5 ratio data is being analyzed, then the Highest (Lowest)
F1/F2 entries become
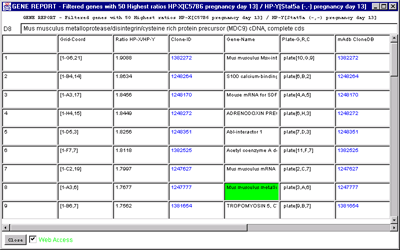
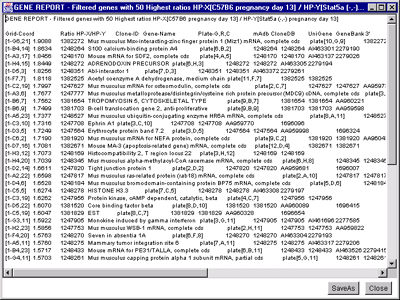
Figure 2.4.6.2 Gene Report windows of 50 named genes with highest
HP-X/HP-Y 'set' ratios. A) Dynamic gene report of 50
genes with highest HP-X/HP-Y 'set' ratios. A similar report may be
generated for the lowest ratios or for single HP-X/HP-Y samples. This
type of report may be generated for the highest or lowest Zdiff values
when the Zscore normalizations are used. Clicking on a blue hypertext
link brings up the corresponding genomic Web database entry in a
separate Web browser window if the Web access is enabled. It also sets
the current gene to the gene for that row. B) The
tab-delimited version of the same report may be cut and then pasted
into other programs such as an Excel spreadsheet.
2.4.6.1 Array report menu - hybridized samples global data
You may generate reports of sample array information. The first two
menu selections contain descriptive information about specific
hybridized microarrays samples. The "Extra Samples info" contains
quantitative and extra descriptive information (if available for your
database).
rSq=0.748, n=1656, HP:1(mn+-sd)=(28991+-19564), HP:2(mn+-sd)=(5044+-9766)
2.4.6.2 Gene reports menu
You may generate gene reports with various additional options. You
must set the Web access checkbox if you want to click on a blue
hyperlink in the resulting report to access an associated Web
database. In addition, specialized gene reports may be generated from
some of the cluster plot command windows. These include lists of
genes sorted by cluster (K-means cluster #), by hierarchical cluster order,
by similarity to a gene, etc. The mean cluster expression values may
be reported for K-means clustering.
![]() - show genes
that meet the data Filter criteria.
- show genes
that meet the data Filter criteria.
2.4.6.2.1 Filtered gene reports menu
You may generate gene reports of Filtered genes with various
additional presentation options. In the highest/lowest N genes, N
defaults to 100 and is set by (Report | Table format | Set max # genes
in highest/lowest report) command.
