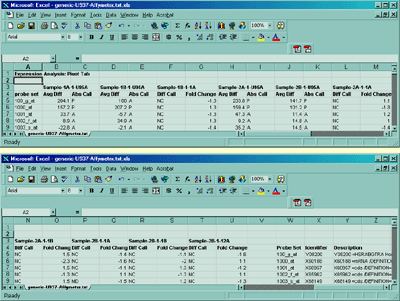
Figure 1. shows the Affymetrix tab-delimited data in Excel. (after missing fields have been edited as described above).
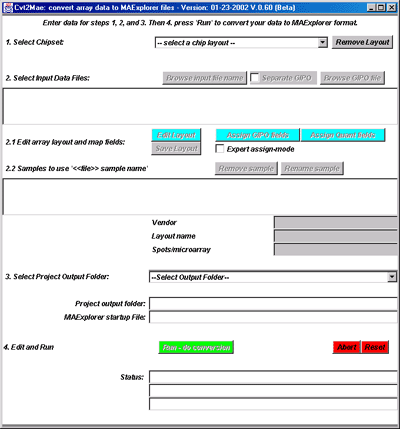
Figure 2. Initial state of the Cvt2Mae Program. The user
must select an array layout or define one in order to analyze the
input data file or files.
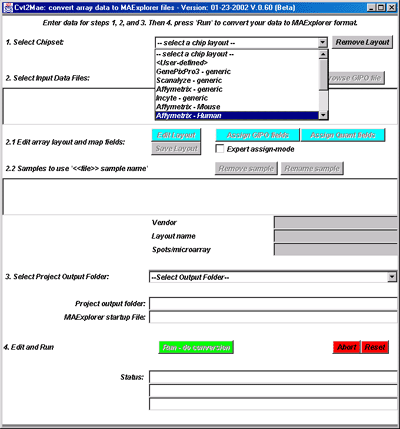
Figure 3. Selecting a Chipset Array Layout. The built-in
array layouts are shown for the Incyte and Affymetrix. User-defined
layouts would be added by selecting the <User-defined> layout.
Figure 4. Select one or more user input data files by pressing the
"Browse input file name" button and then pick a file. If the
layout indicates that it may contain more than one hybridization, it
will attempt to find the data. You can subsequently rename individual
samples which may be necessary if you are reading several files with
the same sub-sample names. After the file browser pops up, select a
user input data file. If you are using a file that contains all of
your samples, then you only need to specify one file. If you have
several files, then repeat this step until you have added all of the
files you want.
Figure 5. Files selected by user and samples "discovered" in the
data file. Each input file is analyzed to determin if it has]
multiple samples and if so they are added to the list of input files
at below step 2.1 in the window. You may remove any samples which may
be necessary for bad data. You may rename any sample which may be
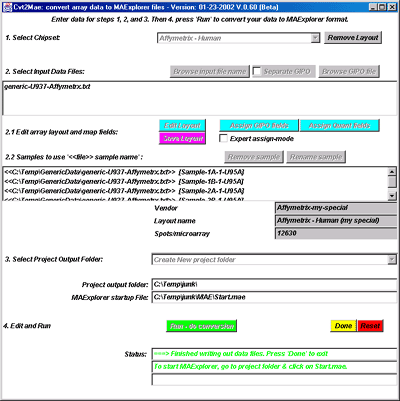
necessary if you have the same sample name occuring
in several different data files (they are actually different samples).
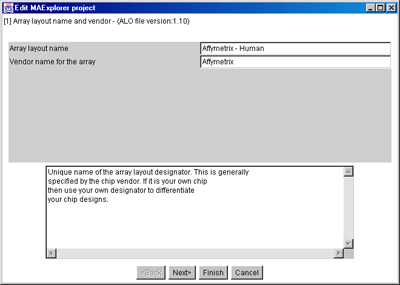
Figure 6. Edit Layout Wizard for name of the Array Layout.
A) is the original array layout frome the database. B)
Since we may want to edit it, we will rename the vendor and Array
layout name. This will enable us to save the changed layout if we
wish. You may not overide system defined layouts, but you may overide
your own layouts or save a system layout under a new name (as is shown
here).
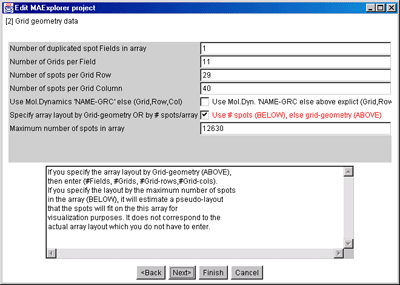
Figure 7. Edit Layout Wizard for Grid Geometry.
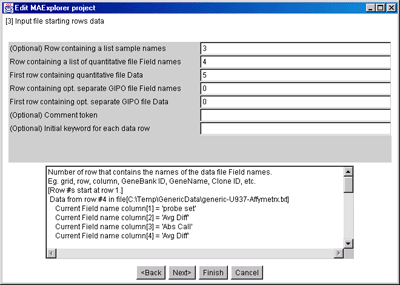
Figure 8. Edit Layout Wizard for Starting Data Rows.
Figure 9. Edit Layout Wizard for Ratio or Intensity data.
Figure 10. Edit Layout Wizard for optional (X,Y) spot coordinates
available in the input data.
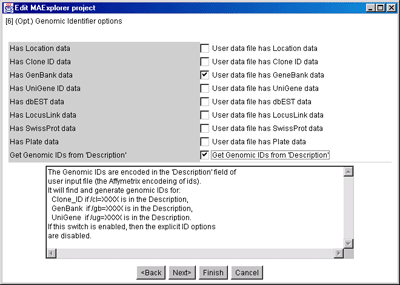
Figure 11. Edit Layout Wizard for optional Genomic ID values
available in the input data.
Figure 12. Edit Layout Wizard for optional Gene Names available
in the data.
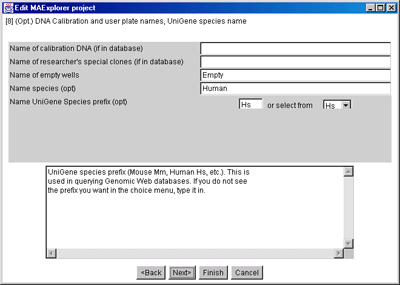
Figure 13. Edit Layout Wizard for optional calibration DNA available
in the data and UniGene species prefix.
Figure 14. Edit Layout Wizard for optional user names for Project,
Database, Subdatabase, etc.
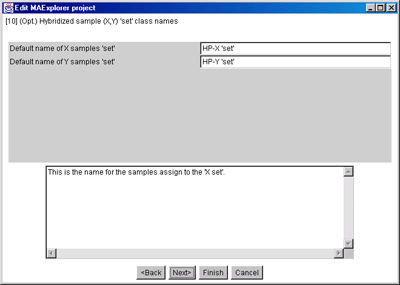
Figure 15. Edit Layout Wizard for optional HP-X and HP-Y 'set' experimental
class (i.e. condition) names.
Figure 16. Edit Layout Wizard for changing the default data filter threshold
slider values.
Figure 17. Edit Layout Wizard for Assign GIPO fields. These Gene-In-Plate-Order data field
mappings should only be changed if required for additional data
fields you may have added to your input file. All fields should be
defined. (it is required for <User-defined> data). In general, it
may be ok to have some non-critical genomic ID fields undefined.
Figure 18. Edit Layout Wizard for Assign Quant fields. These
Quantification data field
mappings should only be changed if required to define all fields
(it is required for <User-defined> data).
Figure 19. Saving modified Array Layout if you have made
changes. This is useful if you have changed the array layout with
"Edit Layout", "Assign GIPO fields", or "Assign Quant fields" so that
you can use it another time.
Figure 20. Selecting the output folder in which to save the
converted files. The Magenta "Save Layout" button means that you
may save the edited array layout if you wish. You now need to create
an output folder to put the converted data. You may create a New
Folder, use an Existing Folder or use the Same Folder that contained
the input files. We selected the "New Folder" option.
Figure 21. Browse to select the output folder in which to save the
converted files. You may create a new folder here.
Select the "name" of the folder - don't go into the folder.
Figure 22. shows the interface after selection of the output file
folder using a file browser. Notice that the current project directory
is now displayed in the interface as well as the location of the MAExplorer
Start.mae file that will be generated. The data will be created when
the Run button is pressed.
Figure 23. shows the conversion being performed after the user
pressed the RUN button. This process takes a minute or so
depending on the speed of the computer and the complexity of the data.
Figure 24. shows the conversion summary instructions after the
conversion is finished. At this point press the DONE button to
exit the converter.
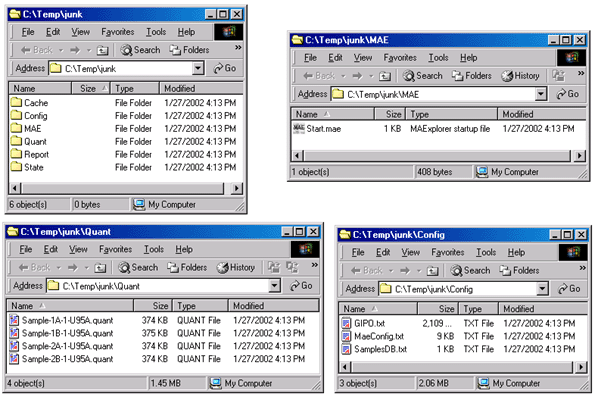
Figure 25. shows the files that are generated by Cvt2Mae for use
by MAExplorer. The generated data consists of several directories
that are described in the Reference Manual Appendix C.
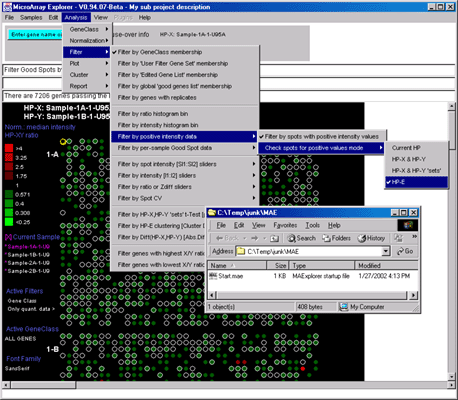
Figure 26. Starting MAExplorer on the converted data by clicking
on Start.mae file. Alternatively, Note that the location of the
"MAExplorer startup file:" is specified. Go to that file and click on
it to start MAExplorer. Alternatively, start MAExplorer and do "File |
Open Disk DB" and open that file to start it.


B)






Mapping Array Layout GIPO and Quant input data field names
In addition to the above global defintions, additonal Array Layout
parameters need to be define. These are mapping of input file data
field names for GIPO and Quant data to the names required by
MAExplorer. There are two wizards for helping define these mappings.
For the predefined Array Layouts these are already setup but may need
to be defined or edited for user-defined data.


