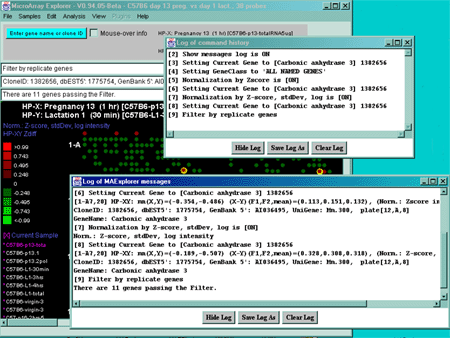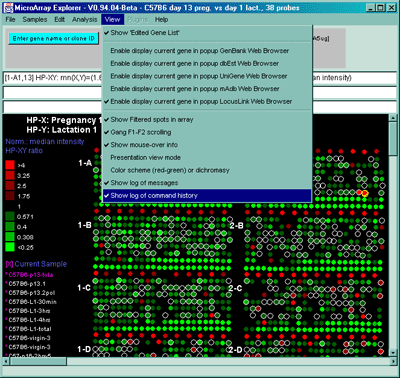

Figure 2.5 View Menu options. These are divided into various options for modifying the presentation as well as recording activity such as the messages or history popup scrollable log windows.
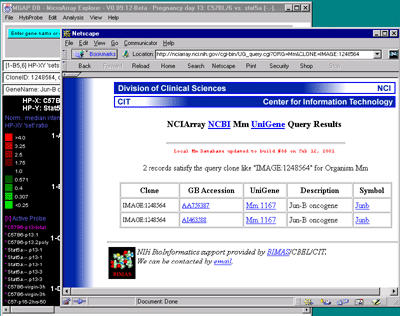
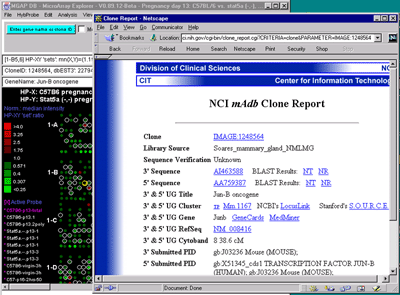
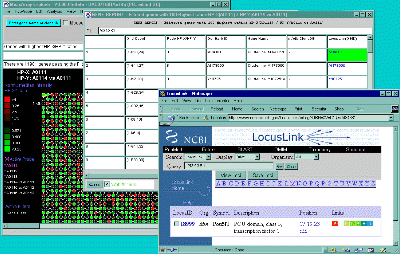
Figure 2.5. Popup genomic browser database page. A) The
UniGene Web page pops up in a new Web browser window when the user
clicks on a gene in the array image, 2D scatter plot or Report and the
view is set to "Display current gene in Unigene Web Browser" toggle
was enabled in the View menu. The current gene was "Jun-B oncogene".
Alternatively, the B) mAdb Gene DB may be selected - as well as
GenBank or dbEST genomic databases. C) Alternatively, data from
the NCBI LocusLink database may be accessed if either the GenBank ID or
LocusID is available.
Figure 2.5.2 Examples of messages and command history popup log
windows. Measurements and other activity are shown in more detail
in the messages window whereas the command history indicates commands
(numbered in the order they are executed) in the command history window.
Data from either of these windows may be saved in text log files.
2.5.1 Logging MAExplorer messages
MAExplorer shows various data measurements as well as many other types
of information in the three text lines in the status area of the main
window. The Show log of messages pops up a scrollable log of
all messages to the three line status area. This is useful for
recording measurements and other activity. The messages may be saved
in log file (typically maeMessages.log). Figure 2.5.2 shows an example
of the messages popup log window. Clicking on genes in the pseudoarray
image or in plots will log the gene data (see Section 3.3) given the
current normalization, Samples use (single or multiple), and
pseudoarray display mode. The current values of all of the State
Threshold scrollers are saved in the message log when the (Edit menu |
Preferences | Adjust all Filter threshold scrollers) State
Thresholds popup window is closed. This is useful for capturing the
current settings at any time.
2.5.2 Logging command history
During a datamining session, the user will typically execute many
commands from the menu as well as clicking on genes in the pseudoarray
image or in plots. It is useful to recording the steps you took during
this analysis. The Show log of command history pops up a
scrollable history of all commands issued to MAExplorer. The commands
are automatically numbered. The history may be saved in log file
(typically maeHistory.log). Figure 2.5.2 shows an example
of the command history popup log window.
