| Note: although this set of normalization methods is limited, it is adequate for some analyses of the data. We are in the process of adding more normalization methods through MAEPlugin methods. |
Some software quantification software (e.g. Research Genetics'
Pathways 2.01) measures background globally as: BGLow (low
background), BGAvg (Average background), BGRms (root mean square
background). For MGAP, MAExplorer uses the BGLow value when you
request background subtraction. These values are read from the
MAExplorer Samples DB file (see Appendix
Table C.2.1.1 For other quantification programs, background may be
available on a per-spot basis in the quantification files. It the
latter is available in your data, it will be used if background
correction is enabled (see
Appendix C.3).
The background corrected intensity I'ij is
computed from the raw intensity Iij and background
intensity bkgrdHPi for H.P. i and spot j as
follows:
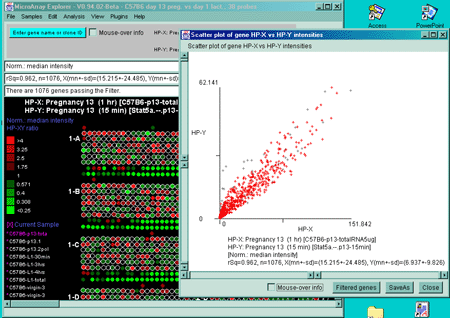
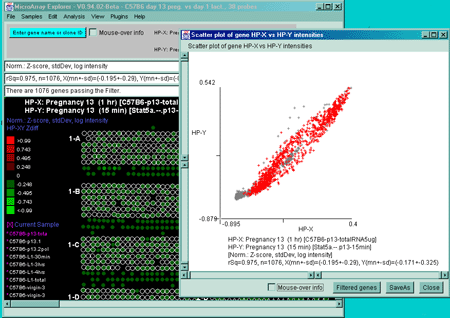
Figure 2.4.2.3 Scatter plot of HP-X and HP-Y 'sets' data. HP-X
is C57B6 pregnancy day 13 and HP-Y is Stat5a (-,-) pregnancy day 13
filtered by "All named genes and ESTs". A) A scatter plot
using the Median normalization. B) A scatter plot using the
Zscore of the logs normalization. Notice how the Casein alpha outlier
is more apparent in the case of the Zscore log normalization. The
skewed plot is characteristic of much microarray data. Some
normalization methods (not currently included in MAExplorer) can
compensate for these some of these artifacts (Dutoit, 2000) and are planned for
future MAEPlugins.
2.4.2.1 Intensity background correction
The background intensity data from the spot quantification programs
may be used to correct spot intensity. Background may be specified as
either a global value or on a per-spot basis. If the array images have
low background, then this may not be too much of a problem if no
background values are available.
I'ij = Ij - bkgrdHPi
Ratio computation for Cy3 and Cy5 data
For most MAExplorer operations, the intensity of a gene is generally
computed as the mean intensity of the spots (background corrected or
not) which duplicate that gene on the microarray. When working with
dual hybridized samples using Cye-3 and Cye-5-dUTP labeling that results
in green and red fluorescence, this can be used in self-normalizing
intensity for each hybridized clone array using the Cy3/Cy5 ratio. If
local background is available, then the ratio can be computed for HP h
and spot j as
(Cy3hj - BkgrdCy3hj) / (Cy5hj - BkgrdCy5hj)
2.4.2.2 Normalization between microarrays to allow comparison
The normalization of quantitative data is crucial when comparing data
between different microarray samples. There are a number of different schemes
possible. One is to normalize by the sum of known calibration,
housekeeping genes or other "constant expression" genes in the
microarray. Another is to sum the background corrected integrated
density for all spots in an array and to normalize individual gene
measurements by that sum. These methods are now described in more
detail. As the MAEPlugins
facility becomes available, we will be adding a number of more
sophisticated gene-specific normalization methods that take many of
the problems specific to microarrays into account.
Normalizing by scaled Zscore of intensity
The "normalized Zscore of intensity" method normalizes each hybridized
sample by the mean and standard deviation of the raw intensities for
all of the spots in that sample. The mean intensity
mnIi and the standard deviation
sdIi are computed for the raw intensity of 'Good
genes'. It is useful for standardizing the mean (to 0.0) and the range
of data between hybridized samples to about -4.0 to +4.0. When using the
Zscore, you compute Zdiff(erences) not ratios. The Zscore intensity
Zscoreij for intensity Iij
for HP i and spot j is computed as
     Zscoreij = (Iij - mnIi)/sdIi,
and
     Zdiffj(x,y) = Zscorexj - Zscoreyj.
Normalizing by the median of intensity
The "Median intensity" method normalizes each hybridized sample by
the median of the raw intensities of 'Good genes' for all of the
spots in that sample. It is a useful normalization to use when you want
to compute X/Y ratios between hybridized samples.
Imij = (Iij/ medianIi)
Normalizing by the log of median of intensity
The "Log median intensity" method normalizes each hybridized sample
by the log of median scaled raw intensities of 'Good genes' for all
of the spots in that sample. The value 1.0 is added to the intensity
value to avoid taking the log(0.0) when intensity has zero value. This
is a useful normalization to use when you want to compute X/Y ratios
between hybridized samples and compress the scale. Because we are computing
a log, we report the difference between HP-X and HP-Y as (X-Y) instead
of a ratio (X/Y).
Imij = log(1.0 + (Iij/ medianIi))
Normalizing by scaled Zscore of log intensity, standard deviation
The "Normalize by Zscore of log intensity, stdDev" method normalizes
each hybridized sample by the mean and standard deviation of the
logs of the raw intensities for all of the spots in that sample. The
mean log intensity mnLIi and the standard
deviation log intensity sdLIi are computed for the
log of raw intensity of 'Good genes'. Then the Zscore intensity
ZlogSij for HP i and spot j is
ZlogSij = (log(Iij) - mnLIi)/sdLIi
Normalizing by scaled Zscore mean absolute deviation of log intensity
The "Normalize by Zscore of log intensity, mean absolute deviation"
method normalizes each hybridized sample by the mean and mean
absolute deviation of the logs of the raw intensities for all of the
spots in that sample. The mean log intensity mnLIi
and the mean absolute deviation log intensity
madLIi are computed for the log of raw intensity
of 'Good genes'. Then the Zscore intensity
ZlogAij for HP i and spot j is
ZlogAij = (log(Iij) - mnLIi)/madLIi
By 'User Normalization Gene Set'
This method is useful a subset of genes have been determined to have
relatively constant expression across the set of samples. It
normalizes by the sum of intensities for a subset of genes defined by
the user in the 'User
Normalization Gene Set' (Section 2.3.2)using the gene set editing
commands. Normalizing by the sum of genes uses the
Igsij that is computed for microarray HPi
with intensities Iij for all genes j in
the gene subset.
     Igsi = Sum (Iij)
        	   genes j
        	   i in HPi
Then, the normalized intensity I'ij is computed as:
I'ij = Iij/Igsi
By 'Calibration DNA' set
If a predefined set of calibration DNA genes are available on the
array, they may be used to normalize density values between the
samples. The calibration DNA genes are defined by special gene names
that are declared in the Configuration file using the 'calibDNAname'
parameter (see Appendix C Table C.5.1(C)). If
there is no calibration DNA, this entry is not used. The algorithm is
the same as "User Normalization Gene Set" (above), but the set is
predefined as the genes flagged as calibration DNA. For example, in
the MGAP database, these spots are the "mouse genomic DNA" spots so
the Configuration file entry would be calibDNAname="m.g. DNA".
Scaling intensity data to 65K
Another method "Scale intensity data to 65K" scales the maximum
intensity of each sample to 65K (the maximum intensity). Since the
raw scanned data is often 16-bits, it can have a maximum value of
65535 (216-1) and so this does minimum scaling. This method
may make it easier to view the data initially using the
pseudoarray image. However, it may not properly scale the data between
arrays and should probably not be used in quantitative comparisons.
No normalization
You may also want to look at the raw intensity (or Cy3 and Cy5
channel) data. Turning off normalization gives you the raw data read
into MAExplorer.
2.4.2.3 Using different normalizations to 'see' different data views
Changing the normalization method will sometimes make differences
between data sets more apparent. The following figure shows the same
data in two different scatter plots but with two different
normalizations.


